Lutfi Al-Sharif, Osama F. Abdel Aal,
Mohammad A. Abuzayyad, Ahmad M. Abu Alqumsan
Mechatronics Engineering Department
University of Jordan, Amman 11942, Jordan
This paper was presented at The 3rd Symposium on Lift & Escalator Technology (CIBSE Lifts Group, The University of Northampton and LEIA) (2013). This web version © Peters Research Ltd 2019.
Keywords: Elevator, lift, round trip time, interval, up peak traffic, rule base, Monte Carlo simulation, average travel time, HARint Space, HARint plane.
Abstract. A previous paper introduced the concept of the HARint plane, which is a tool to visualise the optimality of an elevator design. This paper extends the concept of the HARint plane to the HARint space where the complete set of user requirements is used to implement a compliant elevator traffic design.
In the HARint space, the full set of user requirements are considered: the passenger arrival rate (AR%), the target interval (inttar), the average travelling time (ATT) and the average waiting time (AWT).
The HARint space provides an automated methodology in the form a set of clear steps that will allow the designer to convert these four user requirements into an elevator traffic design.
As with the HARint plane method, the target interval is used in combination with the expected arrival rate (AR%) and the building population, U, in order to find an initial assessment the number of passengers expected to board the elevator. The target average travelling time is then used to select a suitable elevator speed. This is then used to calculate the round trip time and then select the optimum number of elevators. An iteration is then carried out to find the actual number of passengers, and hence the elevator capacity. A check is then carried out to ensure that the average waiting time has been met, and if it has not been achieved, then a further iteration is carried out.
While the HARint plane provides the optimum number of elevator cars to achieve the two user requirements, the HARint space provides the optimum number of elevator as well as the optimum rated speed to meet the four user requirements of arrival rate, target interval, average waiting time and average travelling time.
An obvious consequence of the introduction of the average travelling time as a user requirement is that the speed becomes an outcome of the HARint space. The method also triggers a zoning recommendation in cases where the average travelling time cannot be met by varying the speed within reasonable limits.
Introduction
The HARint plane [1] is a methodology that offers the elevator system designer a design methodology to arrive at an elevator design that meets the user requirements of arrival rate (AR%) and target interval (inttar). In addition, it offers the designer a graphical method to visualise the optimality of a design. Following the full set of steps allows the designer to arrive at an elevator design specifying the number of elevators and their car capacity (assuming a preset elevator rated speed).
The HARint plane methodology however is restricted to one rated speed. By covering a number of different speeds at the same time, the HARint space can show at the same time the optimal solution comprising the number of elevators, their rated speed and the car capacity, thus meeting four user requirements.
As with the HARint plane methodology, the HARint space methodology is applicable to incoming traffic conditions.
The HARint Space Methodology
The HARint Space, like the HARint plane, uses two axes to represent the two most important user requirements: the target interval (inttar) and the arrival rate (AR%). The actual interval is represented on the x-axis and the handling capacity (HC%) is represented on the y-axis, corresponding to the two user requirements, respectively. The HARint plane is restricted to one rated speed. The HARint space on the other hand can represent a number of speeds at the same time.
Figure 1 shows an example of the plot of the HARint space. It can be noticed that there are two types of lines on the HARint space: P lines (curved lines shown in black) and L lines (nearly straight lines plotted in colours, green, red and blue). P stands for the number of passengers boarding the car in one round trip. L stands for the number of elevators in the group. These lines intersect at nearly right angles. The P lines pass through all the solutions that have the same number of P passengers. The L lines pass through all the solutions that have the same number of elevators in the group.
However, as different rated speeds are plotted, the P lines do not change with the change of speed, but there are as many L lines for each speed. The L lines have been shown in different colours, where each colour represents a different speed (as shown by the legend).
As with the HARint plane, the optimal solution should meet the two conditions shown in equations (1) and (2) below, with the smallest number of elevators and the lowest rated speed possible (in that order). But in addition it aims to meet the extra two requirements of the target average travelling time and target average waiting time, show in equations (3) and (4) below.
HC% ≥ AR% (1)
intact ≤ inttar (2)
ATTact ≤ ATTtar (3)
AWTact ≤ AWTtar (4)
The P curves and L lines shown in Figure 1 are based on the following numerical example:
Building parameters:
U= 1200 persons (building population)
N= 10 floors (number of floors above main entrance)
df= 4.5 m (floor height)
User requirements
AR%= 12% (arrival rate as a percentage of the building population in 5 minutes)
inttar= 30 s (the target interval)
ATTtar = 60 s (the target average travelling time)
AWTtar = 10 s (the target average waiting time)
Kinematics
v=1.6 m∙s-1, 2.5 m∙s-1, 4.0 m∙s-1 (rated speed)
a= 1 m∙s-2 (rated acceleration)
j= 1 m∙s-3 (rated jerk)
Door timing
tdo= 2 s
tdc = 3 s
Passenger transfer times
tpi=tpo = 1.2 s
An expanded view of the area of interest of the HARint space for this example is shown in Figure 2. It shows three L lines of interest and three P lines of interest. The three L lines are for 4, 5 and 6 elevators in the group. The three P lines are for 10.8, 14.4 and 18.0 passengers in the car. Notes that each L line comprises three coloured lines for the three speeds.
Figure 3 adds the average travelling time to the expanded view that was shown in Figure 2. Each P lines shows the value of the average travelling time corresponding to each speed. For example, the P line with P= 18.0 passengers, corresponds to an average travelling time of 74.4 s, 73.2 s and 73.2 s for the rated speeds of 1.6 m/s, 2.5 m/s and 4.0 m/s respectively. The round trip time can be evaluated using different methods and tools [2, 3, 4, 5, 6, 7]. The average travelling time can either be calculated using a formula for the simple cases [8] or using Monte Carlo simulation for the more complicated cases [9].
Figure 4 shows how the HARint space works in practice. If the P line P=14.4 passengers is used, it leads to a solution shown on point A where the number of elevators in the group is 5, and the rated speed is 2.5 m/s. However, the average travelling time is not met (actual average travelling time is more that the 60 s target). The solution that meets all four user requirements is shown at point B where the actual travelling time is less than 57.5 s and the average waiting time is 3.8 s. This is achieved by using 6 elevators in the group and a speed of 2.5 m/s.
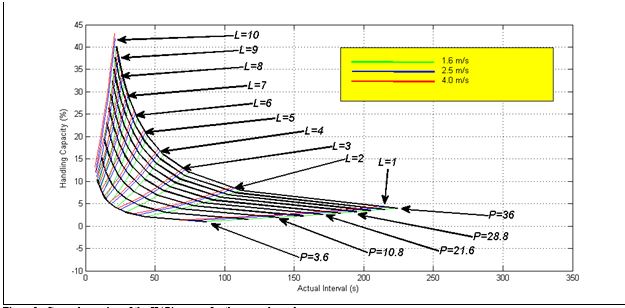
Figure 1: General overview of the HARint space for the example used.
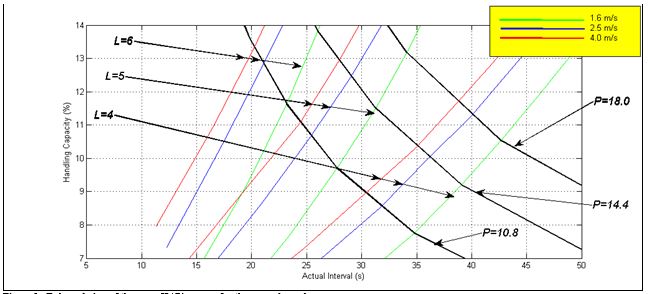
Figure 2: Enlarged view of the same HARint space for the example used.
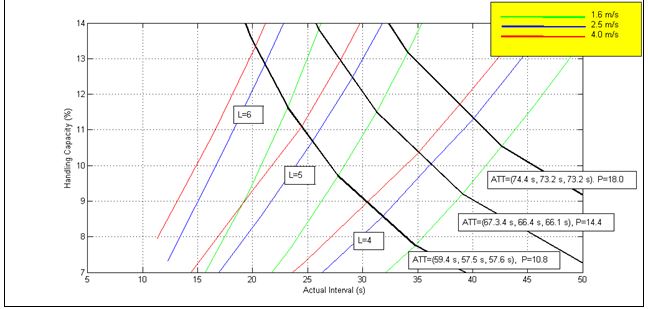
Figure 3: A view that shows that the constant P lines are also constant ATT lines.
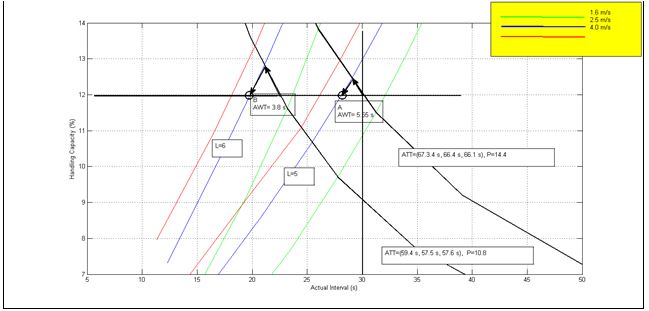
Figure 4: Two solutions A and B, one that meets the ATT requirement and one that does not.
Conclusions
The HARint space has been presented as a methodology that uses four user requirements in order to develop a compliant elevator traffic design. It relies on graphical methods to visualise the final solution.
The four user requirements are: the passenger arrival rate (AR%), the target interval (inttar), the target average travelling time (ATTtar) and the target average waiting time (AWTtar).
A comparison is shown below in table format between the HARint plane method and the HARint space method. The HARint space offers the advantage that it provides the optimum rated speed and meets all the four user requirements instead of just two requirements as is the case in the HARint plane.
| Category | The HARint Plane | The HARint Space |
| User requirements |
|
|
| Optimal outputs |
|
|
| Byproduct output |
|
|
| Triggers |
|
REFERENCES
- Lutfi Al-Sharif, Ahmad M. Abu Alqumsan, Osama F. Abdel Aal, “Automated optimal design methodology of elevator systems using rules and graphical methods (the HARint plane)”, Building Services Engineering Research & Technology, August 2013 vol. 34 no. 3, pp 275-293, doi: 10.1177/0143624412441615.
- CIBSE, “CIBSE Guide D: Transportation systems in buildings”, published by the Chartered Institute of Building Services Engineers, Fourth Edition, 2010.
- G. C. Barney, “Elevator Traffic Handbook: Theory and Practice”, Spon Press, London and New York, ISBN 0-415-27476-1, 2003.
- Richard Peters, “Lift traffic analysis: Formulae for the general case”, Building Services Engineering Research & Technology, 11(2), 1990, pp 65-67.
- Lutfi Al-Sharif, Ahmad M. Abu Alqumsan, Rasha Khaleel, “Derivation of a Universal Elevator Round Trip Time Formula under Incoming Traffic”, Building Services Engineering Research and Technology 0143624413481685, first published on-line June 13th, 2013 as doi:10.1177/0143624413481685.
- Lutfi Al-Sharif, Hussam Dahyat, Laith Al-Kurdi, “ The use of Monte Carlo Simulation in the calculation of the elevator round trip time under up-peak conditions”, Building Services Engineering Research and Technology, volume 33, issue 3 (2012) pp. 319–338, doi:10.1177/0143624411414837.
- Lutfi Al-Sharif, Ahmad Hammoudeh, “Evaluating the Elevator Round Trip Time for Multiple Entrances and Incoming Traffic Conditions using Markov Chain Monte Carlo”, International Journal of Industrial and Systems Engineering (IJISE), Inderscience Publishers, accepted for publication on 4th June 2013.
- http://www.inderscience.com/info/ingeneral/forthcoming.php?jcode=ijise
- So A.T.P. and Suen W.S.M., "New formula for estimating average travel time", Elevatori, Vol. 31, No. 4, 2002, pp. 66-70.
- Lutfi Al-Sharif, Osama F. Abdel Aal, Ahmad M. Abu Alqumsan, “The use of Monte Carlo simulation to evaluate the passenger average travelling time under up-peak traffic conditions”, Chartered Institute of Building Services Engineers, Symposium on Lift and Escalator Technologies, 29th September 2011, University of Northampton, United Kingdom (www.liftsymposium.org/index.php/previous-events).