A New Paradigm for Assessing the Effectiveness of Up-Peak Group Control Algorithms
Lutfi Al-Sharif
Mechatronics Engineering Department,
The University of Jordan, Amman 11942, Jordan,
This email address is being protected from spambots. You need JavaScript enabled to view it.
This paper was presented at The 5th Symposium on Lift & Escalator Technology (CIBSE Lifts Group and The University of Northampton) (2014). This web version © Peters Research Ltd 2016
Keywords: elevator; lift; group control; up peak traffic; static sectoring; dynamic sectoring; destination group control; numerical methods; Monte Carlo simulation method.
Abstract
Elevator group control is critical to the optimal operation of elevator traffic systems under general traffic conditions. In the last 20 years, new elevator group control algorithms have become available for use under up-peak traffic conditions. These up-peak algorithms can be generally classified into three categories: static sectoring, dynamic sectoring and destination group control.
It is customary to use simulation to assess the effectiveness of group control algorithms. This paper offers a new approach, which is built around numerical methods.
Numerical methods can be used to objectively assess the effectiveness of an up-peak group control algorithm by subjecting the group controller to a large number of random scenarios. Each random scenario comprises a set of randomly generated passenger destinations. The performance of each scenario is recorded and the average performance of all the scenarios is used as an indicator of the effectiveness of the algorithm.
The conditions under which the scenarios are run and the algorithms executed can gradually move from the fully idealised conditions to the fully realistic conditions. There are a number of benefits to this approach which will be outlined in the paper.
1 Introduction
Elevator group control is probably the most important mathematical problem to solve in elevator systems. It is a very demanding task as it has, even for the simplest of situations, an excessively large number of possible solutions. The aim of the elevator group control algorithm is to find the solution that optimises a certain parameter of interest. The optimisation could involve one or more of the following: maximising the handling capacity, minimising the average waiting time or the average travelling time.
Elevator group control is only applicable to systems having two or more elevators operating in the same group. They have a common set of landing calls. The function of the group controller is to allocate the landing calls as soon as they are registered to one (and only one) of the elevators in the group, in order to minimise one or more of the parameters above. It is usually not possible with destination control systems to de-allocate the landing call from the elevator and re-allocate it to a different elevator in case a better allocation becomes available.
Moreover, the decision on the allocation of a new landing call to a specific elevator in the group has to be taken within a very short period of time (usually less than 500 ms). This places a large burden on the elevator group real time controller.
With the proliferation of new elevator group control algorithms, it has become necessary to objectively assess and compare these different group control algorithms. This is critical to the successful design of the vertical transportation system for a building, independently of the specific implementations that the suppliers adopt. Simulation has traditionally been the tool used to do so. This new paradigm can complement simulation in many areas.
This paper suggests a new paradigm for assessing up peak group control algorithms. It is based on two pillars: numerical scenario testing (NST) and progressive introduction of reality (PIR).
Section 2 provides an overview of the generic classifications of the elevator group control algorithms. The first pillar of the new paradigm is introduced in section 3, called the Progressive Introduction of Reality (PIR). Numerical Scenario Testing (NST) is the second pillar of the new paradigm and is introduced in section 4. Some advantages of the new paradigm are listed in section 5. Section 6 previews some results from the application of the method for a sample building. Conclusions are drawn in section 7.
2 Elevator Group Control Algorithms
Group control algorithms can be sub-divided into two main categories in accordance with the type of prevailing traffic as follows:
- General traffic group control algorithms: These group control algorithms are applied under any mix of traffic patterns (incoming; outgoing; inter-floor). Although some of the ideas presented in this paper could be applied to these group control algorithms, this will not be discussed in any detail in this paper as it is thus beyond its scope.
- Up-peak Group Control algorithms: These group control algorithms are used in cases where the main component of passenger traffic is entering the building from the main entrance and heading to the occupant floors above. This group of group control algorithms is discussed in more detail below.
It has usually been accepted that once an up-peak situation has been detected or manually selected there is very little that the group controller can do under the conventional up peak conditions other than two obvious actions. These two actions consist of returning the cars back to the main terminal as soon as they have delivered the passengers to their destinations; and controlling the status of the doors of any cars present at the main terminal in order to fill up one elevator car at a time and allow it to depart and then open the doors of other waiting cars one at a time.
However, this has changed with the introduction of a number of up-peak group control algorithms, such as static sectoring, dynamic sectoring and destination group control.
In static sectoring [1], the building is split up during the up-peak period into a number of sectors where each sector contains a number of contiguous floors having equal populations. Every time an elevator arrives at the main terminal, the elevator is assigned to a certain sector, and this is communicated to the waiting passengers at the main terminal. Dynamic sectoring operates in a similar way but with the difference that the sizes of the sectors change continuously ([2], [3], [4], [5], [6]).
Destination group control systems allow the passengers to register their destinations prior to boarding the elevator ([7], [8], [9], [10], [11]). The group control system can thus allocate the landing call to the most suitable elevator in the group and inform the passenger waiting in the lobby. As the elevator has more information, it is possible to make a better allocation decision.
The three algorithms provide an improvement in handling capacity of the elevator system. This boost attains it largest value under up peak traffic conditions ([12], [13]). The methodology outlined in this paper is suitable for assessing and comparing these three elevator group control algorithms, although the examples given have been restricted to the case of destination group control.
3 Progressive Introduction of Reality (PIR)
The first pillar that this new paradigm is based on is the concept of Progressive Introduction of Reality (PIR). The results of the assessment under fully idealized conditions are referred to as the Idealised Optimal Benchmark (IOB) which has been discussed in more detail in [12]. The IOB offers an upper limit on the performance to which all subsequent results can be compared. As real life conditions are introduced, the general rule is that the performance of the system deteriorates.
The various parameters or conditions that can be varied are shown diagrammatically in Figure 1, where fully idealized conditions are shown on the left hand-side, while real life conditions are shown on the right hand side. Of particular interest is the condition of assessing the parameters using one round trip time as the analysis workspace as opposed to using a longer period of time as the analysis workspace, where this condition is particularly important when assessing the value of the average waiting time using Monte Carlo simulation.
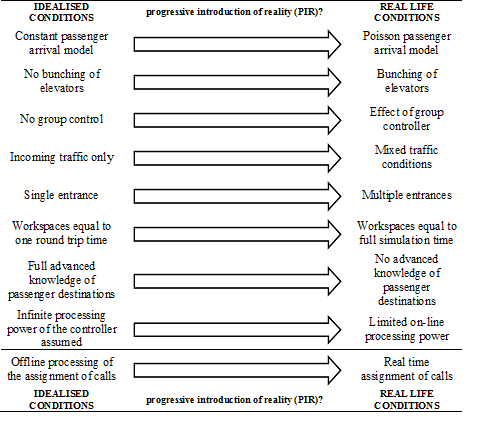
Figure 1: Diagrammatic representation of the concept of progressive introduction of reality (PIR).
The concept of PIR has also been applied in deriving a formula for the round trip time, starting from the case of single entrance, incoming traffic, equal floor heights in [14], moving to multiple entrances, incoming traffic, equal floor heights in [15], moving to multiple entrances, incoming traffic, unequal floor heights, top speed not attained in one floor journey in [16] and then ending with multiple entrance, mixed traffic condition, unequal floor heights and top speed not attained in one floor journey in [17].
4 Numerical Scenario Testing (NST)
This section outlines the methodology used for assessing the destination group control algorithm under up peak conditions ([12], [13], [18], [19]). As shown in [20] in detail, the number of possible combinations is astronomically large. It is thus not practical or realistic to list all of the possible scenarios and to enumerate every possible solution to each scenario.
A more practical solution is to take a sample of the possible scenarios using Monte Carlo simulation, and then to solve each scenario using heuristics or rules of thumb. It is also possible to solve the scenarios using other optimisation techniques (e.g. single step and multi-step random searches). These solution methods are not intended in any way to be used in real time elevator group control systems, but they are used for off-line evaluation studies.
- The following are the steps followed in assessing a group control algorithm using numerical methods:
- Generate a new possible scenario: A new scenario is generated using a random scenario generator. This is done by randomly assigning each passenger to a floor with the probabilities linked to the floor populations.
- For each of the possible scenarios generated in i above, find the most suitable solution by using heuristic (rule based) methods or by using random search techniques. The solution will show an allocation of the L·P passengers to the L elevators. The solution will attempt to optimise a certain parameter (e.g., the smallest value of the round trip time and hence the largest handling capacity).
- Steps i and ii are repeated until a large number of scenarios have been considered (e.g., 100 000 or 1 000 000).
- Once done, the average value of the best solution for all the scenarios is calculated and is used as a representative assessment of the group control algorithm.
When considering an elevator group control such as destination for example, there are a number of methods in which the L·P passengers can be allocated to the L elevators. These methods fall mainly into two broad categories: Random searches and rule based algorithms. Examples are given below:
- Fixed step size random search. Using this tool, the software randomly makes a single change in the allocation by swapping the allocation of two passengers to two different elevators. If the optimisation target is reduced, then the swap is retained; otherwise it is rejected. This process is repeated until no more improvement can be achieved after a certain number of steps.
- Rule based allocation. Using this tool, a set of rules guides the user to splitting the sectors in the building such that the target parameter is optimised.
5 Advantages of the Paradigm
Using this paradigm for assessing the effectiveness of up-peak group control algorithms offers the following advantages, among many others:
- The effect of each introduction of a reality condition can be assessed independently of the other changes. This can be insightful to the designer of the algorithm in understanding the impact of each condition, and can be helpful in guiding the designer of the algorithm to make useful changes.
- The numerical scenario testing is transparent and can be easily described by the use of rules and heuristics, allowing reproducibility.
- It provides an overall limit on the performance of the algorithms, and thus the designer need not spend too much time on trying to improve an algorithm that is very near the benchmark.
6 Sample Results
A sample of the results found so far will be given in this section for destination group control. In assessing the destination group control algorithm operating under peak traffic conditions, four distinct stages can be traversed in moving from idealised conditions to real life conditions, as shown in Figure 2 below. The first stage is to develop an idealised optimal benchmark using equations. The next stage is generating random scenarios and solving them offline, assuming perfect advanced knowledge of the passenger destination. This is referred to as offline allocation of landing calls. The next stage is real time allocation of the landing calls, where only one landing call is revealed to the controller at a time. The final stage is real time simulation of the whole system, which then takes into consideration the movement of the elevator cars. The boost in handling capacity progressively deteriorates with the transition at every stage.
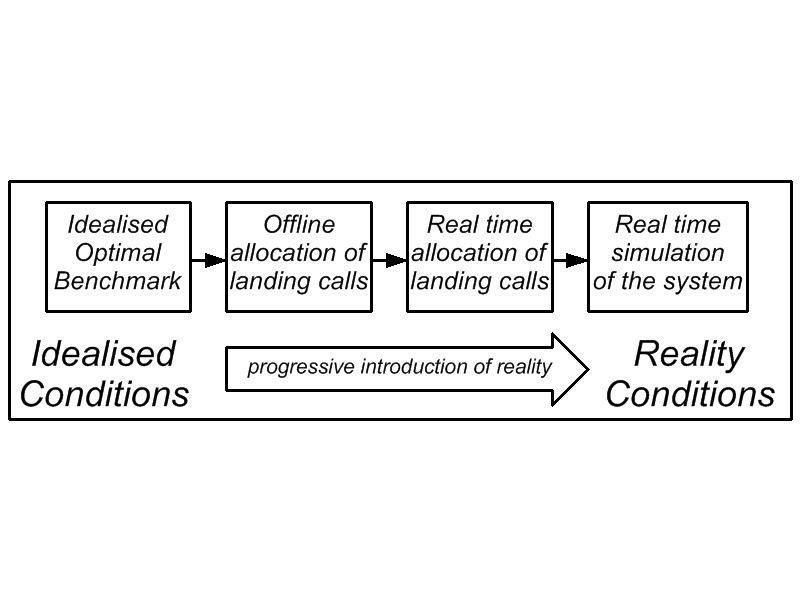
Figure 2: Applying the concept of PIR to the analysis of the performance of destination group control algorithms.
This has been applied to a single entrance sample building that has the parameters shown in Table 1 below.
Table 1: Sample building used.
| Number of Elevators in the group (L) | 4 |
| Number of Passengers in the Car (P) | 7 |
| Number of floors above the main entrance (N) | 10 |
| Total building population (U) | 600 |
| Floor height in m (df) | 4.2 |
The boost in handling capacity compared to the conventional group control has been used as the benchmark for comparison of the effectiveness of each reality condition. The boost in handling capacity has been shown for the benchmark, offline allocation and real-time allocation of calls in Table 2, where the boost in handling capacity with the IOB is 148% (i.e., an increase of 48%). Full details of the workings of the real time allocation and the effect of the number of elevators in the group can be found in [21].
Table 2: Sample results for a building under destination group control that aims to minimise the average round trip time or maximise the handling capacity of the system assuming contiguous equal size sectors.
| Algorithm/Equation | Boost in Handling Capacity |
| Idealised Optimal Benchmark (IOB) [12] | 148% |
| Minimisation of H then S (offline allocation) [13] | 142% |
| Minimisation of H only (offline allocation) [13] | 140% |
| Minimisation of S only (offline allocation) [13] | 134% |
| Real time allocation [21] | 125% |
7 Conclusions
Elevator group control algorithms can be generally sub-divided into general traffic condition algorithms and up-peak traffic condition algorithms. The up-peak group control algorithms can be further sub-divided into three types: static sectoring, dynamic sectoring and destination group control algorithms.
Simulation has traditionally been used as the tool for assessing the effectiveness of elevator group control algorithms. This paper presents a suggested new paradigm that relies on the use of numerical scenario testing (NST) and progressive introduction of reality (PIR) in order to assess the effectiveness of up peak group control algorithms. Under numerical scenario testing, the Monte Carlo simulation method is used whereby random passenger destinations are generated and the optimum solution is found for each scenario and recorded. The average of all the large number of trials is then calculated and used as representative of the performance of the algorithm, under the conditions assumed. The progressive introduction of reality starts the analysis under the most ideal conditions and then progressively changes the conditions to more real life conditions.
The advantages of this new paradigm is that it is fully transparent thus allowing reproducibility, provides insights to the algorithm designer regarding the effect of different conditions on the effectiveness of the algorithm and provides an upper limit benchmark that no algorithm can ever surpass.
Results were presented for a sample building in which the method was applied for the assessment of an algorithm for destination group control. The resultant boost in handling capacity was 148% under the idealised conditions and dropped to 125% for the real time allocation of landing calls conditions.
REFERENCES
- Bruce Powell, “Important issues in up peak traffic handling”, in Elevator Technology 4, International Association of Elevator Engineers, Proceedings of Elevcon ’92, May 1992, Amsterdam, The Netherlands, pp 207-218.
- W. L. Chan and Albert T. P. So, “Dynamic zoning for intelligent supervisory control”, International Journal of Elevator Engineering, Volume 1, 1996, pp 47-59.
- W. L. Chan and Albert T. P. So, “Dynamic zoning in elevator traffic control”, in Elevator Technology 6, International Association of Elevator Engineers, Proceedings of Elevcon ’95, March 1995, Hong Kong, pp 133-140.
- Zhonghua Li, Zongyuan Mao and Jianping Wu, “Research on Dynamic Zoning of Elevator Traffic Based on Artificial Immune Algorithm”, 8th International Conference on Control, Automation, Robotics and Vision”, Kumming, China, 6th-9th December 2004.
- Albert T.P. So, J.K.L. Yu, “Intelligent supervisory control for lifts: dynamic zoning”, Building Services Engineering Research & Technology, Volume 22, Issue 1, 2001, pp. 14-33.
- Suying Yang, Jianzhe Tai, Cheng Shao, “Dynamic partition of elevator group control system with destination floor guidance in up-peak traffic”, Journal of Computers, Volume 4, Number 1, January 2009, pp 45-52.
- Richard Peters, “Understanding the benefits and limitations of destination dispatch”, in Elevator Technology 16, The International Association of Elevator Engineers, the proceedings of Elevcon 2006, June 2006, Helsinki, Finland, pp 258-269.
- Rory Smith, Richard Peters, “ETD algorithm with destination dispatch and booster options”, in Elevator Technology 12, International Association of Elevator Engineers, Proceedings of Elevcon 2002, Milan, Italy, 2002, pp 247-257.
- Schroeder, J., “Elevatoring calculation, probable stops and reversal floor, “M10” destination halls calls + instant call assignments”, in Elevator Technology 3, Proceedings of Elevcon ’90, International Association of Elevator Engineers, 1990, pp 199-204.
- Janne Sorsa, Henri Hakonen, Marja-Liisa Siikonen, “Elevator selection with destination control system”, in Elevator Technology 15, International Association of Elevator Engineers, Proceedings of Elevcon 2005, Peking, China.
- Jorg Lauener, “Traffic performance of elevators with destination control”, Elevator World, September 2007, pp 86-94.
- Al-Sharif L, Hamdan J, Hussein M, et al. Establishing the upper performance limit of destination elevator group control using idealised optimal benchmarks (IOB). Build Service Eng Res Technol (submitted March 2014) (under review).
- Al-Sharif L, Hamdan J, Jaber Z, et al. The effect of the number of elevators in a group on the upper performance limit of destination group control. Am J Math Manage Sci (submitted February 2014) (under review).
- G.C. Barney, “Elevator Traffic Handbook: Theory and Practice”, Taylor & Francis, 2002.
- Lutfi Al-Sharif, “The effect of multiple entrances on the elevator round trip time under up-peak traffic”, Mathematical and Computer Modelling 52(3-4):545-555 (2010).
- Lutfi Al-Sharif, Ahmad M. Abu Alqumsan, Rasha Khaleel, “Derivation of a Universal Elevator Round Trip Time Formula under Incoming Traffic with Stepwise Verification”, Building Services Engineering Research and Technology, 2014, Vol. 35 issue 2, pp 198–213, doi 0143624413481685.
- Lutfi Al-Sharif and Ahmad M Abu Alqumsan, “Stepwise derivation and verification of a universal elevator round trip time formula for general traffic conditions”, Building Services Engineering Research & Technology, published online before print, DOI: 10.1177/0143624414542111.
- Moh’d M. Malak, Daoud Tuffaha, Mohamed Hussein, “Modeling and Simulation of dynamic sectoring in Elevator Traffic Analysis and Control”, final year graduation project, Supervisor: Dr. Lutfi Al-Sharif, Mechatronics Engineering Department, The University of Jordan, December 2012.
- Khaled Alkiswani, Haneen Almahmoud, “Elevator Group Control System Simulation based on Destination Group Control”, final year graduation project, Supervisor: Dr. Lutfi Al-Sharif, Mechatronics Engineering Department, The University of Jordan, May 2013.
- Lutfi Al-Sharif, Mohamed Hussein, Moh’d Malak, Daoud Tuffaha, “The Use of Numerical Methods to Evaluate the Performance of Up Peak Group Control Algorithms”, Proceedings of Elevcon 2014, Paris, 8th to 10th July 2014, pp 327-337.
- Lutfi Al-Sharif, Anas Riyal, Zaid Jaber, Jamal Hamdan, “Assessing the Up-Peak Performance of Destination Elevator Group Control Systems using Real Time Allocation of Landing Calls”, The Scientific World Journal, (submitted May 2014), (under review).
BIOGRAPHICAL DETAILS
Lutfi Al-Sharif received his Ph.D. in lift traffic analysis in 1992 from the University of Manchester. He worked for 9 years for London Underground, London, United Kingdom in the area of lifts and escalators. In 2002, he formed Al-Sharif VTC Ltd, a vertical transportation consultancy based in London, United Kingdom. He has 17 published papers in peer reviewed journals the area of vertical transportation systems and is co-inventor of four patents. He is currently Associate Professor in the Department of Mechatronic Engineering at The University of Jordan, Amman, Jordan.
About Us
Professor Lutfi Al-Sharif

Lutfi Al-Sharif has a degree in Electrical Engineering, a Ph.D. degree in the applications and use of simulation and neural networks in vertical transportation systems and a Post-Graduate Diploma in Business Administration. He is a Professor at the University of Jordan and a Visiting Professor at the University of Northampton. He is a Chartered Engineer, Member of the Institution of Engineering and Technology and Member of the Institute of Electrical and Electronics Engineers.
Prof Al-Sharif worked as a Lift and Electrical Project Team Leader and headed a Business Unit at London Underground before joining WSP as an Associate Director, and then running his own consultancy firm. Currently he combines his university teaching schedule with consultancy and training for Peters Research Ltd.
For further information please click here
Mrs Jane Dallas
Jane Dallas joined Peters Research Ltd in 2008. Her main duties involve general office/administrative support, to the team, helping to look after the running of the office and accounts.
Mr Sam Dean

Sam Dean is a Software Engineer with Peters Research Ltd. He is part of the team working on enhancements to Elevate and related software projects. He is the lead developer behind the websites and databases managed by Peters Research.
Mrs Elizabeth Evans

Elizabeth Evans joined Peters Research Ltd in 2005. She is involved with various aspects of the business including research into lift passenger demand. She was awarded a CIBSE Carter bronze medal in 2012 and has been a member of the CIBSE Lifts Group Executive since 2013.
For further information please click here
Mr Jim Nickerson

Jim Nickerson has been working with Peters Research as a Software Engineer Consultant since 2009 and has been involved with the development of Elevate Live.
Previous to this Jim worked for ThyssenKrupp Elevator and DigiMetric Inc.
For further information please click here.
Dr Mike Pentney

Dr Mike Pentney has a BSc (Hons) in Electrical and Electronic Engineering and a PhD in Experimental Particle Physics. Mike worked freelance with Peters Research for about 20 years before joining as a staff member in 2017. He writes software for Elevate and associated Peters Research Ltd products.
Previously, Dr Pentney worked as a research associate at Queen Mary & Westfield College and Brunel University. He was a member of the UA2 collaboration studying collisions between protons and anti-protons at the SPS particle accelerator at Cern and later became an CERN Research Fellow.
He is a Chartered Physicist CPhys, MInstP (Institute of Physics)
For further information please click here
Dr Richard Peters

Richard Peters has a degree in Electrical Engineering, a Doctorate for research in Vertical Transportation, and is a Visiting Professor at the University of Northampton. He has been awarded Fellowship of the Institution of Engineering and Technology, and of the Chartered Institution of Building Services Engineers. He is a past Chairman of the Lifts Group of the Chartered Institution of Building Services Engineers.
Dr Peters worked for ten years with international engineering consultants Ove Arup & Partners. In 1997, he set up his own company, Peters Research Ltd to provide software development and engineering consultancy.
Dr Peters provides advice on a range of vertical transportation issues to clients and has notable expertise elevator traffic analysis, simulation and dispatching. He supports PhD students at Northampton University.
Dr Peters is the author of Elevate, traffic analysis and simulation software. Elevate has become a worldwide industry standard, applied by more elevator professionals than any other traffic design software. Elevate is currently licensed to companies in over 60 countries. His elevator dispatching concepts and software developed using Elevate are implemented in some of the world’s most challenging projects.
For further information please click here
Dr Rory Smith

Rory Smith is a consultant to Peters Research Ltd. He has over 49 years experience in all aspects of the lift industry including, engineering, maintenance and research and development. He worked for ThyssenKrupp Elevator for 25 years in various roles and was involved in ThyssenKrupp’s Internet of Things.
Rory's areas of special interest are Robotics, Machine Learning, High-Rise Design, Traffic Analysis, Dispatching Algorithms and Ride Quality. Numerous patents have been awarded for his work.
He is a Visiting Professor in Lift Technology at the University of Northampton and has been awarded Fellowship of the Chartered Institution of Building Services Engineers.
For further information please click here.
Converting the User Requirements into an Elevator Traffic Design: The HARint Space
Lutfi Al-Sharif, Osama F. Abdel Aal,
Mohammad A. Abuzayyad, Ahmad M. Abu Alqumsan
Mechatronics Engineering Department
University of Jordan, Amman 11942, Jordan
This email address is being protected from spambots. You need JavaScript enabled to view it.
This paper was presented at The 5th Symposium on Lift & Escalator Technology (CIBSE Lifts Group and The University of Northampton) (2013). This web version © Peters Research Ltd 2016
Keywords: Elevator, lift, round trip time, interval, up peak traffic, rule base, Monte Carlo simulation, average travel time, HARint Space, HARint plane.
Abstract. A previous paper introduced the concept of the HARint plane, which is a tool to visualise the optimality of an elevator design. This paper extends the concept of the HARint plane to the HARint space where the complete set of user requirements is used to implement a compliant elevator traffic design.
In the HARint space, the full set of user requirements are considered: the passenger arrival rate (AR%), the target interval (inttar), the average travelling time (ATT) and the average waiting time (AWT).
The HARint space provides an automated methodology in the form a set of clear steps that will allow the designer to convert these four user requirements into an elevator traffic design.
As with the HARint plane method, the target interval is used in combination with the expected arrival rate (AR%) and the building population, U, in order to find an initial assessment the number of passengers expected to board the elevator. The target average travelling time is then used to select a suitable elevator speed. This is then used to calculate the round trip time and then select the optimum number of elevators. An iteration is then carried out to find the actual number of passengers, and hence the elevator capacity. A check is then carried out to ensure that the average waiting time has been met, and if it has not been achieved, then a further iteration is carried out.
While the HARint plane provides the optimum number of elevator cars to achieve the two user requirements, the HARint space provides the optimum number of elevator as well as the optimum rated speed to meet the four user requirements of arrival rate, target interval, average waiting time and average travelling time.
An obvious consequence of the introduction of the average travelling time as a user requirement is that the speed becomes an outcome of the HARint space. The method also triggers a zoning recommendation in cases where the average travelling time cannot be met by varying the speed within reasonable limits.
1. Introduction
The HARint plane [1] is a methodology that offers the elevator system designer a design methodology to arrive at an elevator design that meets the user requirements of arrival rate (AR%) and target interval (inttar). In addition, it offers the designer a graphical method to visualise the optimality of a design. Following the full set of steps allows the designer to arrive at an elevator design specifying the number of elevators and their car capacity (assuming a preset elevator rated speed).
The HARint plane methodology however is restricted to one rated speed. By covering a number of different speeds at the same time, the HARint space can show at the same time the optimal solution comprising the number of elevators, their rated speed and the car capacity, thus meeting four user requirements.
As with the HARint plane methodology, the HARint space methodology is applicable to incoming traffic conditions.
2. The HARint Space Methodology
The HARint Space, like the HARint plane, uses two axes to represent the two most important user requirements: the target interval (inttar) and the arrival rate (AR%). The actual interval is represented on the x-axis and the handling capacity (HC%) is represented on the y-axis, corresponding to the two user requirements, respectively. The HARint plane is restricted to one rated speed. The HARint space on the other hand can represent a number of speeds at the same time.
Figure 1 shows an example of the plot of the HARint space. It can be noticed that there are two types of lines on the HARint space: P lines (curved lines shown in black) and L lines (nearly straight lines plotted in colours, green, red and blue). P stands for the number of passengers boarding the car in one round trip. L stands for the number of elevators in the group. These lines intersect at nearly right angles. The P lines pass through all the solutions that have the same number of P passengers. The L lines pass through all the solutions that have the same number of elevators in the group.
However, as different rated speeds are plotted, the P lines do not change with the change of speed, but there are as many L lines for each speed. The L lines have been shown in different colours, where each colour represents a different speed (as shown by the legend).
As with the HARint plane, the optimal solution should meet the two conditions shown in equations (1) and (2) below, with the smallest number of elevators and the lowest rated speed possible (in that order). But in addition it aims to meet the extra two requirements of the target average travelling time and target average waiting time, show in equations (3) and (4) below.
HC% ≥ AR% (1)
intact ≤ inttar (2)
ATTact ≤ ATTtar (3)
AWTact ≤ AWTtar (4)
The P curves and L lines shown in Figure 1 are based on the following numerical example:
Building parameters:
U= 1200 persons (building population)
N= 10 floors (number of floors above main entrance)
df= 4.5 m (floor height)
User requirements
AR%= 12% (arrival rate as a percentage of the building population in 5 minutes)
inttar= 30 s (the target interval)
ATTtar = 60 s (the target average travelling time)
AWTtar = 10 s (the target average waiting time)
Kinematics
v=1.6 m∙s-1, 2.5 m∙s-1, 4.0 m∙s-1 (rated speed)
a= 1 m∙s-2 (rated acceleration)
j= 1 m∙s-3 (rated jerk)
Door timing
tdo= 2 s
tdc = 3 s
Passenger transfer times
tpi=tpo = 1.2 s
An expanded view of the area of interest of the HARint space for this example is shown in Figure 2. It shows three L lines of interest and three P lines of interest. The three L lines are for 4, 5 and 6 elevators in the group. The three P lines are for 10.8, 14.4 and 18.0 passengers in the car. Notes that each L line comprises three coloured lines for the three speeds.
Figure 3 adds the average travelling time to the expanded view that was shown in Figure 2. Each P lines shows the value of the average travelling time corresponding to each speed. For example, the P line with P= 18.0 passengers, corresponds to an average travelling time of 74.4 s, 73.2 s and 73.2 s for the rated speeds of 1.6 m/s, 2.5 m/s and 4.0 m/s respectively. The round trip time can be evaluated using different methods and tools [2, 3, 4, 5, 6, 7]. The average travelling time can either be calculated using a formula for the simple cases [8] or using Monte Carlo simulation for the more complicated cases [9].
Figure 4 shows how the HARint space works in practice. If the P line P=14.4 passengers is used, it leads to a solution shown on point A where the number of elevators in the group is 5, and the rated speed is 2.5 m/s. However, the average travelling time is not met (actual average travelling time is more that the 60 s target). The solution that meets all four user requirements is shown at point B where the actual travelling time is less than 57.5 s and the average waiting time is 3.8 s. This is achieved by using 6 elevators in the group and a speed of 2.5 m/s.

Figure 1: General overview of the HARint space for the example used.
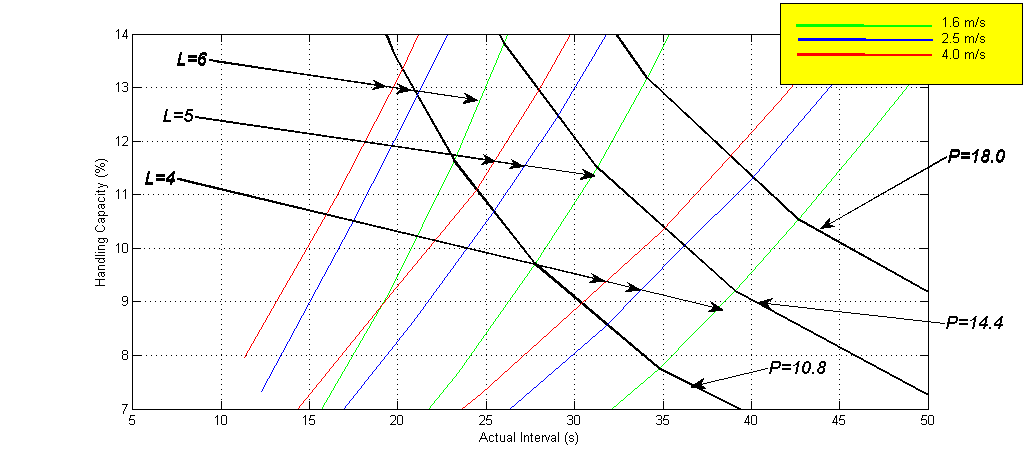
Figure 2: Enlarged view of the same HARint space for the example used.
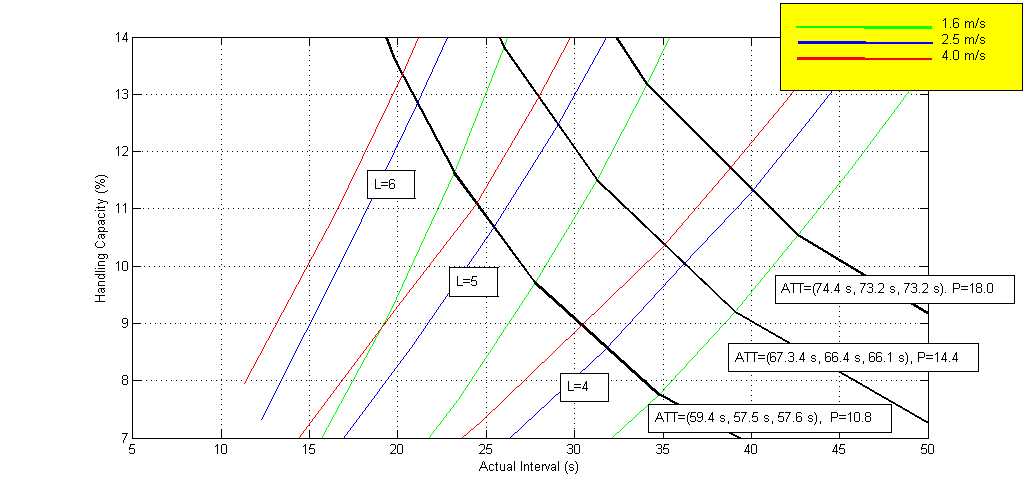
Figure 3: A view that shows that the constant P lines are also constant ATT lines.
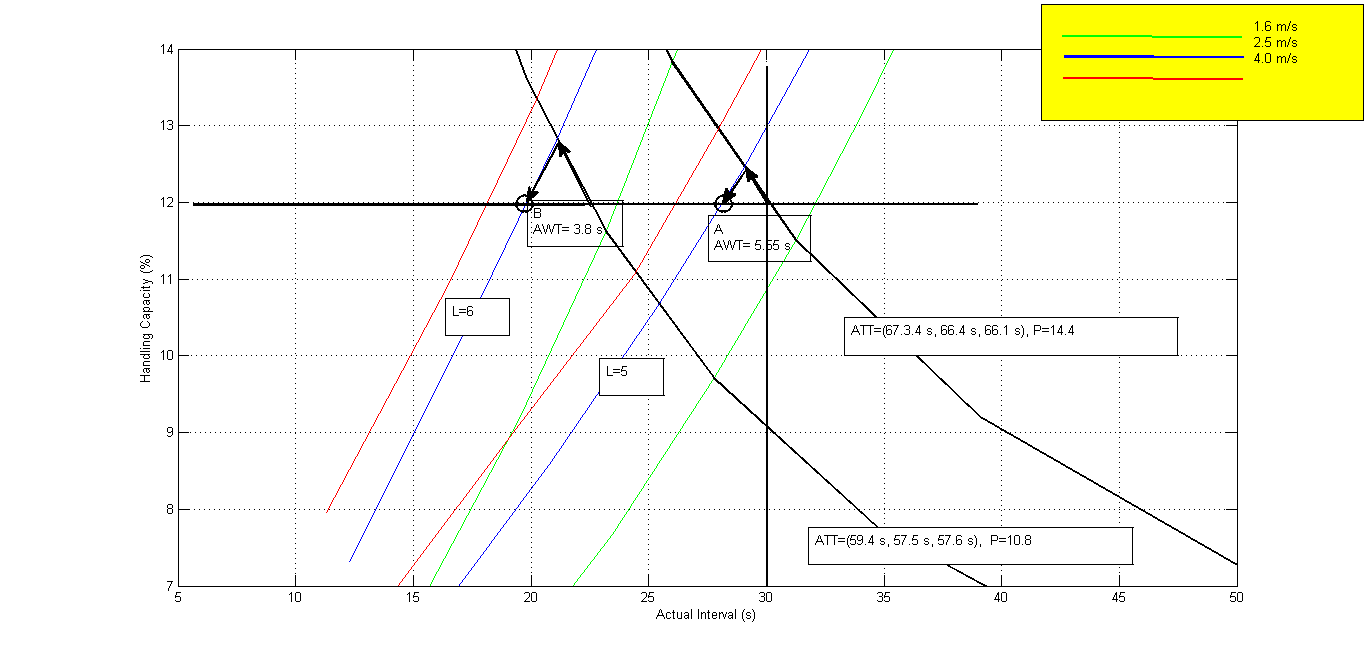
Figure 4: Two solutions A and B, one that meets the ATT requirement and one that does not.
3. Conclusions
The HARint space has been presented as a methodology that uses four user requirements in order to develop a compliant elevator traffic design. It relies on graphical methods to visualise the final solution.
The four user requirements are: the passenger arrival rate (AR%), the target interval (inttar), the target average travelling time (ATTtar) and the target average waiting time (AWTtar).
A comparison is shown below in table format between the HARint plane method and the HARint space method. The HARint space offers the advantage that it provides the optimum rated speed and meets all the four user requirements instead of just two requirements as is the case in the HARint plane.
| Category | The HARint Plane | The HARint Space |
| User requirements |
|
|
| Optimal outputs |
|
|
| Byproduct output |
|
|
| Triggers |
|
REFERENCES
- Lutfi Al-Sharif, Ahmad M. Abu Alqumsan, Osama F. Abdel Aal, “Automated optimal design methodology of elevator systems using rules and graphical methods (the HARint plane)”, Building Services Engineering Research & Technology, August 2013 vol. 34 no. 3, pp 275-293, doi: 10.1177/0143624412441615.
- CIBSE, “CIBSE Guide D: Transportation systems in buildings”, published by the Chartered Institute of Building Services Engineers, Fourth Edition, 2010.
- G. C. Barney, “Elevator Traffic Handbook: Theory and Practice”, Spon Press, London and New York, ISBN 0-415-27476-1, 2003.
- Richard Peters, “Lift traffic analysis: Formulae for the general case”, Building Services Engineering Research & Technology, 11(2), 1990, pp 65-67.
- Lutfi Al-Sharif, Ahmad M. Abu Alqumsan, Rasha Khaleel, “Derivation of a Universal Elevator Round Trip Time Formula under Incoming Traffic”, Building Services Engineering Research and Technology 0143624413481685, first published on-line June 13th, 2013 as doi:10.1177/0143624413481685.
- Lutfi Al-Sharif, Hussam Dahyat, Laith Al-Kurdi, “ The use of Monte Carlo Simulation in the calculation of the elevator round trip time under up-peak conditions”, Building Services Engineering Research and Technology, volume 33, issue 3 (2012) pp. 319–338, doi:10.1177/0143624411414837.
- Lutfi Al-Sharif, Ahmad Hammoudeh, “Evaluating the Elevator Round Trip Time for Multiple Entrances and Incoming Traffic Conditions using Markov Chain Monte Carlo”, International Journal of Industrial and Systems Engineering (IJISE), Inderscience Publishers, accepted for publication on 4th June 2013. http://www.inderscience.com/info/ingeneral/forthcoming.php?jcode=ijise
- So A.T.P. and Suen W.S.M., "New formula for estimating average travel time", Elevatori, Vol. 31, No. 4, 2002, pp. 66-70.
- Lutfi Al-Sharif, Osama F. Abdel Aal, Ahmad M. Abu Alqumsan, “The use of Monte Carlo simulation to evaluate the passenger average travelling time under up-peak traffic conditions”, Chartered Institute of Building Services Engineers, Symposium on Lift and Escalator Technologies, 29th September 2011, University of Northampton, United Kingdom (www.liftsymposium.org/index.php/previous-events).
BIOGRAPHICAL DETAILS
Lutfi Al-Sharif received his Ph.D. in lift traffic analysis in 1992 from the University of Manchester. He worked for 9 years for London Underground, London, United Kingdom in the area of lifts and escalators. In 2002, he formed Al-Sharif VTC Ltd, a vertical transportation consultancy based in London, United Kingdom. He has 17 published papers in peer reviewed journals the area of vertical transportation systems and is co-inventor of four patents. He is currently Associate Professor in the Department of Mechatronic Engineering at The University of Jordan, Amman, Jordan.
Bunching in Lift Systems
Dr. Lutfi R. Al-Sharif B.Sc., M.Sc., Ph.D., AMIEE
Control Systems Centre
UMIST
Manchester M60 1QD / U.K.
Published in Elevator Technology 5, Proceedings of the International Conference on Elevator Technology (Elevcon ‘93), November 1993, Vienna, Austria. This web version © Peters Research Ltd 2016
Abstract
Bunching increases passenger waiting time, but does not affect system handling capacity. This paper shows using a practical example, how bunching can increase passenger waiting time.
It is quite essential to be able to measure bunching quantitatively, in order to compare the performance of different systems, of different sizes. In order to do this, two measurement coefficients are presented and discussed: simulation based bunching factor, bx, and measurement based bunching coefficient, BC2. The advantages and disadvantages of both coefficients are outlined, along with methods for implementing them within software packages.
1.0 Introduction
The ideal situation in lift traffic control is to keep the lifts in the group as far apart as possible, when they are circulating in up-peak. In fact, some of the early control algorithms control the lift system by dispatching the lifts from the main terminal at fixed intervals of time, in order to keep the lifts equally apart during their trips (Barney & Dos Santos, 1985, pp 37).
When the time interval between cars leaving the main terminal is not equal, bunching occurs and degrades the performance of the lift system. It has been proposed that the reason for the rapid increase of average waiting time (AWT) at loads above 50% is caused by the effects of bunching (Schroeder, June 1990).
A typical case of bunching can be seen in lift systems when the lifts start following each other (or even frog-leaping), as they serve adjacent calls in the same direction. This has a detrimental effect on passenger waiting time. The ultimate case is when all the lifts in the group move together, acting effectively as one huge lift with a capacity equal to the summation of the capacities of all the lifts in the group.
On the other hand, when no bunching exists, the AWT attains it minimum optimum value, which is equal to half the calculated up peak interval (UPPINT), namely AWT = UPPINT/2. This is based on the assumption that a uniformly distributed probability density function applies for the arrival rate of passengers. In fact, the design of lift systems relies on calculating the RTT (round trip time) and deriving the AWT from this based on an ideal assumption that UPPINT = RTT/L, where L is the number of lifts in the group.
Bunching affects waiting times, but will not usually affect handling capacity (Schroeder, June 1990).
2. The Effect of Bunching on Waiting Time
As mentioned in the previous section, bunching in lifts systems increases waiting time, but does not affect handling capacity. This section aims to discuss an example of how irregular arrival of the lifts leads to an increase in waiting time.
Figure 1 shows a ideal case of regular arrivals of two lifts in a group, A and B. The round trip time of the system is 50 seconds, as shown by the consecutive arrivals of lift A (A and A'), and the interval between individual arrivals is 25 seconds.
Figure 2 shows a situation where bunching occurs, and lift B arrives 10 seconds after lift A.
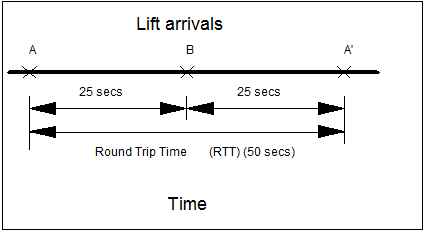
Figure 1: Regular arrival patter of two lifts A and B
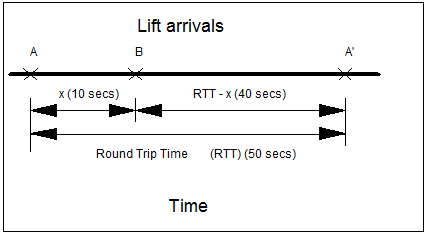
Figure 2: Irregular arrival pattern of two lifts A and B, and effect on waiting time
The average waiting time can be calculated for both situations. For the purposes of this exercise, it can be assumed that a constant uniform passenger arrival rate exists, at a rate of one passenger per second. In the first case, the standard formula can just be used (INT = RTT/2), which gives INT = 50/2 = 25 seconds. Assuming a uniform arrival rate, the AWT is taken as AWT = INT/2 = 12.5.
In the bunching case, there are 10 x 1 = 10 passengers arriving during the first period [A-B], and having to wait between 0 and 10 seconds. In the second period [B-A'], it is expected that 40 x 1 = 40 passengers will arrive, having to wait between 0 and 40 seconds. Thus the average waiting time for each period will be half the maximum waiting time (assuming a uniform arrival rate). The total average waiting time is a weighted sum of both waiting times.
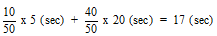
This is also based on the assumption that car A is large enough to carry all 40 passengers, with none of them having to wait for car B.
If the case is considered where the cars have a limited capacity (say 25 passengers in this case), then only 25 passengers out of the 40 passengers will be able to board car A, while the other 15 passengers will have to wait for another 10 seconds. Thus,

...which is three seconds more than the 17 seconds, which was based on the assumption of infinitely sized cars.
3.0 Simulation Based Bunching Factor (bx).
Having shown the effect of bunching on waiting time in the previous section, this section attempts to outline a measurement coefficient for bunching, based on simulation. The next section develops a formula based coefficient.
Figure 3 shows a typical curve describing the relationship between the loading factor (some authors use the more generic term, "system utilisation", Barney & Dos Santos, 1985, pp 21), and an index of performance. The ratio of AWT to INT has been proposed as a measure of performance of the lift system (Barney & dos Santos, 1985, pp201). The loading factor is expressed as the ratio between the number of passengers and the rated capacity. The index of performance is taken as the ratio between the Average Waiting Time (AWT) and the Interval (INT), where division by the Interval is a method of normalising the measure of performance.
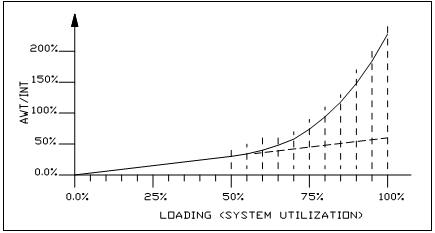
Figure 3: Relationship between System loading and AWT/INT, with a straight extrapolation of the linear part below 50% loading.
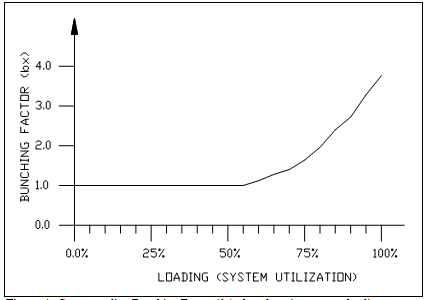
Figure 4: Corresponding Bunching Factor (bx) plotted against system loading.
The curve is linear in the region of loading 0% to 50%. As the system loading increases above 50%, the curve departs from linear behaviour, and increases rapidly. The linear relationship existing below 50% loading can be extrapolated as shown in Figure 3 by the dotted line. So it is possible to draw a straight line as a continuation of the linear relationship which exists at loads below 50%.
It has been proposed by Schroeder (June 1990), that the departure from this linear behaviour at loads of more than 50% is caused by the phenomenon of bunching in the lift system. Schroeder further proposes that the measure of bunching is the ratio between two quantities. The numerator is the actual AWT is at a certain system loading. The denominator is the value the AWT would have been if the linear relationship applied above 50% system loading. This is given the name Bunching Factor, bx. An example of this concept is shown in Figure 4, where these ratios have been taken from Figure 3, and the resulting ratios plotted as the Bunching Factor, bx, against system loading.
It is possible to investigate this point further by obtaining this performance/load curve for groups of lifts with lifts from one to eight, through simulation. Once the curves have been obtained through simulation, it would be possible to derive the bunching factor (bx) from these curves against system loading, in the same way that this have been done in Figure 4. Consequently, a three dimensional plot of the bunching factor (bx) against system loading and against the number of lifts in the group can be plotted.
This has actually been carried out by performing the simulations and plotting the curves. Then the bunching factor (bx) has been derived for system loading levels between 60% and 80% (80%, 77.3%, 74.6%, 72%, 69.3%, 66.6%, 64%). Figure 5 shows a three dimensional plot of the resulting bunching factor against system loading and the number of lifts in the group.
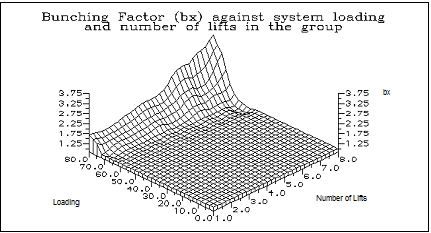
Figure 5: Bunching Factor (bx) against system loading and number of lifts in the group.
The following remarks are worth mentioning, regarding the plot:
- The bunching factor bx takes on values ranging from 1 to 3.75. The value of 1 corresponds to no bunching in the system.
- As the number of lifts in the group increases, the bunching in the lifts system at the same loading level increases as well.
- Bunching starts to be displayed at a system loading of around 65%, although it varies. Bunching starts to be displayed at smaller loading levels with increasing numbers of lifts in the group.
- Bunching is displayed even with a single lift in the group. Intuitively, we would expect no bunching in the case of one lift in a group. This depends on the definition of bunching in the first place; it might be considered that variations from the calculated average Round Trip Time is a form of bunching even if only one lift exists in a group.
One of the points raised by Schroeder as well is that the Bunching Factor will increase as the number of lifts increase; thus no bunching will occur with one lift in the group (i.e., a Bunching Factor of 1.0 will prevail), and the Bunching Factor will increase until it achieves its maximum value with a group of eight lifts (Eight is the maximum number of lifts in one single group as specified by general practice).
So the Bunching Factor can be expressed as a function of two variables: System Loading and the Number of the lifts in the group.
Bunching Factor (bx) = ƒ(L,SL)
...where
- ƒ is a function of the two variables,
- L is the number of lifts in the group and
- SL is the system loading expressed as a percentage of system capacity.
Schroeder (June 1990) has produced a curve similar to the curve in Figure 5, with the following two main differences:
- A factor of bunching of 1 has been plotted for a group of one lift.
- Bunching starts at lower system loading levels (40% in the case of eight lifts, 60% in the case of two lifts).
One drawback of this factor of bunching (bx) is that a single lift system would still follow the same relationship between AWT/INT and system loading. But bunching by definition cannot apply to a group with one lift.
4.0 Formula Based Bunching Coefficient (BC).
This section develops a formula based approach for measuring bunching. Consequently, bunching could be measured directly from the lift system behaviour, and satisfying certain requirements at the same time.
4.1 Basic Requirements of the Bunching Coefficient (BC).
The requirements to be satisfied by any bunching coefficient, can be summarised as follows:
- Normalisation: It has to be normalised, so that it is independent of the parameters of the system under consideration. This will enable it to be used as an additional measurement of performance between different systems.
- Formula Based: It would be preferable if it could be measured instantaneously (on-line) from the lift behaviour, without having to compile large amounts of data for analysis.
- Limited Range: It must have a defined range of values (e.g., 0.0 to 1.0, where 0.0 represents no bunching and 1.0 represent full bunching). Full Bunching implies that lifts are all moving together like one huge lift (with a capacity equal to the summation of all the capacities of the individual lifts in the group). No Bunching means that lifts are moving equally apart, or in more precise terms are leaving the main terminal at equal intervals (in the cases of up and down peak traffic conditions, where these intervals must be equal to round trip time divided by the number of lifts in the group, RTT/n), or reversing their direction of travel at equal intervals in the case of interfloor traffic or other traffic conditions. Due to the fact that we can define these two extremes of bunching in such a precise manner, it is reasonable to try to define the limits of the corresponding bunching coefficients at 0.0 and 1.0, and eventually find a mapping function or formula between them.
- It must produce a coefficient of bunching of zero for a group of one lift.
4.2 Approach Used.
An intuitive concept to use for the formula, would be to define the ideal behaviour of the lift system under no bunching conditions, to calculate the amount of deviation from such ideal performance and then to use such a measure as an indication of the amount of bunching.
The ideal behaviour of a lift system under up peak traffic conditions and with no bunching, is that lifts depart from the main terminal at equal intervals, equal in value to the Up Peak Interval (UPPINT), which is calculated as the Round Trip Time divided by the number of lifts in the group (RTT/L).
If the time between lift number i departing and lift number i+1 is defined as ti,i+1, then the difference between this time and the ideal time can be taken as the measure of how much bunching is prevailing in the system behaviour. Thus the quantity
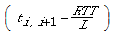
...must be used in the formula. It is to be noted that positive and negative deviation from the ideal value are equally harmful (early arrival of a lift is as bad as late arrival). So, the absolute value of the above quantity has to be taken.
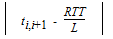
Taking the absolute value assigns equal costs to positive and negative deviations from the ideal value, based on the assumption that an equal cost is incurred in both cases.
One major drawback of using the absolute value of the difference, is that it gives equal weighting to small and large deviations of departure intervals from the ideal value (RTT/L). One way to penalise large deviations from RTT/L is to square the difference (this will also obviate the need for taking the absolute value, as the square of any quantity is always positive).
Summing up all deviations arising from all the lifts in the group, gives a representation of how the lifts in the group are deviating form a bunching free ideal performance.
The value of the sum of all of these deviations at full bunching is used as a normalising factor. As this is the maximum value that can be attained at full bunching, it is used for normalisation, by dividing the sum of absolute values of deviations by it.
This bunching coefficient would be called BC2, to indicate that is uses the square of the deviation. The full formula is shown in Al-Sharif & Barney (1992a). (The term tL,1 denotes the time lapse between the FIRST departure of lift number L and the NEXT departure of lift number 1, and NOT the first departure of lift number 1. It is assumed that, within one RTT, all the lifts have returned to the main terminal.)
As can be verified, this formula satisfies all the criteria set out in section 4.1, as it lies between 0.0 and 1.0, it can be measured over one RTT, is independent of the lift system because it is normalised and it gives a bunching coefficient of 0.0 for a group of one lift (L=1).
Figures 6 is a three dimensional plot of the BC2 for a group of three lifts, against two time intervals. The first time interval (Y axis) is the time lapse between the departure of the first lift in the group from the main terminal, t1,2. The second interval (X axis) is the time lapse between the departure of first lift in the group and the third lift from the main terminal, t1,3. A RTT of 120 seconds, and an INT of 40 seconds are assumed.
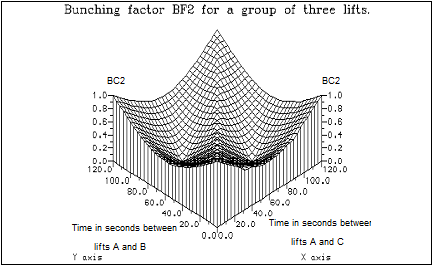
Figure 6: A plot of the bunching coefficient against the time intervals (in seconds) between lifts departing from main terminal. It is based on an assumption of a 120 second RTT, and an INT of 40 seconds.
It can be seen from Figure 6 that BC2 attains the minimum values of 0.0 when X= 40 and Y = 80 or when X=80 and Y = 40 which is the case when equal intervals occur. On the other hand, BC2 is 1.0 (full bunching), when X=0 and Y=0 or X=120 and Y=0 or X=0 and Y = 120 or X=120 and Y=120, which is shown by the value of 1.0 at the four corners of the plot. All these cases correspond to full bunching, as the lifts are all departing at the same time.
5.0 Conclusions.
Bunching in lift systems affects waiting time. A practical example has been shown, by which the effect of bunching in a group of two lifts has led to an increase in waiting time from 12.5 seconds to 20 seconds.
In order to measure bunching , two approaches have been used: simulation based and formula based.
The bunching factor bx can be extracted from simulation data, and is shown to increase with the increase in system loading and the number of lifts. It suffers from the disadvantage that is cannot be instantaneously measured from the lift system activity.
The second order bunching coefficient, BC2, is formula based and can be calculated from the measured values of the interval. This coefficient produces a value of 1 at full bunching (all cars moving as one huge car), and 0.0 at no bunching (equal intervals between car arrivals at main terminal). The measurement of the bunching in this way can give an estimation of the quality of the performance, and can be carried out while the lift system is running.
The quantitative measurement of bunching in lift systems is useful in providing an objective comparison between lift system performance, regardless of any differences in system configuration.
BIOGRAPHICAL NOTES AND ACKNOWLEDGEMENT
The author would like to thank Intelev Ltd.(Bolton/England) for sponsoring the research carried out here, and for Dr. G.C. Barney for supervising the research.
L.R.Al-Sharif graduated in electrical engineering from the University of Jordan in 1987. He worked for two years at the Jordan Lift & Crane Mfg. Co. as an electronic designer of Lift controllers. He received his M.Sc. in Remote Lift Monitoring from UMIST in 1990, and his Ph.D. in the applications of Artificial Intelligence and probability theory in predictive methods for lift systems in 1992. He is currently Electrical Design Engineer at the Lift & Escalator Engineer's Department, at London Underground Ltd.
REFERENCES
- AL-SHARIF, L.R., 1992, "Predictive methods in lift traffic analysis", Ph.D. Thesis, Control Systems Centre, UMIST/ Manchester, October 1992.
- AL-SHARIF, L.R. & BARNEY, G.C., 1992a, "Bunching Factors in Lift Systems (1)", Control Systems Centre Report number 749, Feb. 1992, UMIST/Manchester.
- AL-SHARIF, L.R. & BARNEY, G.C., 1992b, "Lift System Simulation and Loading Curves", Control Systems Centre Report number 750, Feb. 1992, UMIST/Manchester.
- AL-SHARIF, L.R. & BARNEY, G.C., 1992c, "Bunching Factors in Lift Systems (2)", Control Systems Centre Report number 754, June 1992, UMIST/Manchester.
- ALEXANDRIS, N.A., 1977, "Statistical Models in Lift Systems", Ph.D. Thesis, Control Systems Centre, UMIST, April, 1977.
- BARNEY, G.C., 1992, "Uppeak Revisited", Elevator Technology 4, Editor Dr. G.C.Barney, The International Association of Elevator Engineers, 1992.
- BARNEY, G.C. & DOS SANTOS, S.M., 1979, "User's guide to LSD", Control Systems Centre, 2 August 1979.
- BARNEY & DOS-SANTOS, 1985, "Elevator Traffic Analysis, Design and Control", Second Edition, Peter Peregrinus, 1985.
- DOS SANTOS, S.M., 1974, "The design evaluation and control of lift systems", Ph.D. thesis, Control Systems Centre, UMIST, October 1974 (pp 78 - 85).
- GAVER, D.P. & POWELL, B.A., 1971, "Variability in Round Trip Time for an Elevator Car During Up Peak", Transportation Science, pp. 169 - 179.
- POWELL, B.A., 1992, "Important Issues in Uppeak Traffic Handling", Elevator Technology 4, Editor Dr. G.C.Barney, The International Association of Elevator Engineers, 1992.
- SCHROEDER, J., 1990, "Elevator Traffic: Elevatoring, Simulation, Data recording. The Data compatibility problem and its solution", Elevator World, June 1990.
Converting the User Requirements into an Elevator Traffic Design: The HARint Space
Lutfi Al-Sharif, Osama F. Abdel Aal,
Mohammad A. Abuzayyad, Ahmad M. Abu Alqumsan
Mechatronics Engineering Department
University of Jordan, Amman 11942, Jordan
This paper was presented at The 3rd Symposium on Lift & Escalator Technology (CIBSE Lifts Group, The University of Northampton and LEIA) (2013). This web version © Peters Research Ltd 2019.
Keywords: Elevator, lift, round trip time, interval, up peak traffic, rule base, Monte Carlo simulation, average travel time, HARint Space, HARint plane.
Abstract. A previous paper introduced the concept of the HARint plane, which is a tool to visualise the optimality of an elevator design. This paper extends the concept of the HARint plane to the HARint space where the complete set of user requirements is used to implement a compliant elevator traffic design.
In the HARint space, the full set of user requirements are considered: the passenger arrival rate (AR%), the target interval (inttar), the average travelling time (ATT) and the average waiting time (AWT).
The HARint space provides an automated methodology in the form a set of clear steps that will allow the designer to convert these four user requirements into an elevator traffic design.
As with the HARint plane method, the target interval is used in combination with the expected arrival rate (AR%) and the building population, U, in order to find an initial assessment the number of passengers expected to board the elevator. The target average travelling time is then used to select a suitable elevator speed. This is then used to calculate the round trip time and then select the optimum number of elevators. An iteration is then carried out to find the actual number of passengers, and hence the elevator capacity. A check is then carried out to ensure that the average waiting time has been met, and if it has not been achieved, then a further iteration is carried out.
While the HARint plane provides the optimum number of elevator cars to achieve the two user requirements, the HARint space provides the optimum number of elevator as well as the optimum rated speed to meet the four user requirements of arrival rate, target interval, average waiting time and average travelling time.
An obvious consequence of the introduction of the average travelling time as a user requirement is that the speed becomes an outcome of the HARint space. The method also triggers a zoning recommendation in cases where the average travelling time cannot be met by varying the speed within reasonable limits.
Introduction
The HARint plane [1] is a methodology that offers the elevator system designer a design methodology to arrive at an elevator design that meets the user requirements of arrival rate (AR%) and target interval (inttar). In addition, it offers the designer a graphical method to visualise the optimality of a design. Following the full set of steps allows the designer to arrive at an elevator design specifying the number of elevators and their car capacity (assuming a preset elevator rated speed).
The HARint plane methodology however is restricted to one rated speed. By covering a number of different speeds at the same time, the HARint space can show at the same time the optimal solution comprising the number of elevators, their rated speed and the car capacity, thus meeting four user requirements.
As with the HARint plane methodology, the HARint space methodology is applicable to incoming traffic conditions.
The HARint Space Methodology
The HARint Space, like the HARint plane, uses two axes to represent the two most important user requirements: the target interval (inttar) and the arrival rate (AR%). The actual interval is represented on the x-axis and the handling capacity (HC%) is represented on the y-axis, corresponding to the two user requirements, respectively. The HARint plane is restricted to one rated speed. The HARint space on the other hand can represent a number of speeds at the same time.
Figure 1 shows an example of the plot of the HARint space. It can be noticed that there are two types of lines on the HARint space: P lines (curved lines shown in black) and L lines (nearly straight lines plotted in colours, green, red and blue). P stands for the number of passengers boarding the car in one round trip. L stands for the number of elevators in the group. These lines intersect at nearly right angles. The P lines pass through all the solutions that have the same number of P passengers. The L lines pass through all the solutions that have the same number of elevators in the group.
However, as different rated speeds are plotted, the P lines do not change with the change of speed, but there are as many L lines for each speed. The L lines have been shown in different colours, where each colour represents a different speed (as shown by the legend).
As with the HARint plane, the optimal solution should meet the two conditions shown in equations (1) and (2) below, with the smallest number of elevators and the lowest rated speed possible (in that order). But in addition it aims to meet the extra two requirements of the target average travelling time and target average waiting time, show in equations (3) and (4) below.
HC% ≥ AR% (1)
intact ≤ inttar (2)
ATTact ≤ ATTtar (3)
AWTact ≤ AWTtar (4)
The P curves and L lines shown in Figure 1 are based on the following numerical example:
Building parameters:
U= 1200 persons (building population)
N= 10 floors (number of floors above main entrance)
df= 4.5 m (floor height)
User requirements
AR%= 12% (arrival rate as a percentage of the building population in 5 minutes)
inttar= 30 s (the target interval)
ATTtar = 60 s (the target average travelling time)
AWTtar = 10 s (the target average waiting time)
Kinematics
v=1.6 m∙s-1, 2.5 m∙s-1, 4.0 m∙s-1 (rated speed)
a= 1 m∙s-2 (rated acceleration)
j= 1 m∙s-3 (rated jerk)
Door timing
tdo= 2 s
tdc = 3 s
Passenger transfer times
tpi=tpo = 1.2 s
An expanded view of the area of interest of the HARint space for this example is shown in Figure 2. It shows three L lines of interest and three P lines of interest. The three L lines are for 4, 5 and 6 elevators in the group. The three P lines are for 10.8, 14.4 and 18.0 passengers in the car. Notes that each L line comprises three coloured lines for the three speeds.
Figure 3 adds the average travelling time to the expanded view that was shown in Figure 2. Each P lines shows the value of the average travelling time corresponding to each speed. For example, the P line with P= 18.0 passengers, corresponds to an average travelling time of 74.4 s, 73.2 s and 73.2 s for the rated speeds of 1.6 m/s, 2.5 m/s and 4.0 m/s respectively. The round trip time can be evaluated using different methods and tools [2, 3, 4, 5, 6, 7]. The average travelling time can either be calculated using a formula for the simple cases [8] or using Monte Carlo simulation for the more complicated cases [9].
Figure 4 shows how the HARint space works in practice. If the P line P=14.4 passengers is used, it leads to a solution shown on point A where the number of elevators in the group is 5, and the rated speed is 2.5 m/s. However, the average travelling time is not met (actual average travelling time is more that the 60 s target). The solution that meets all four user requirements is shown at point B where the actual travelling time is less than 57.5 s and the average waiting time is 3.8 s. This is achieved by using 6 elevators in the group and a speed of 2.5 m/s.
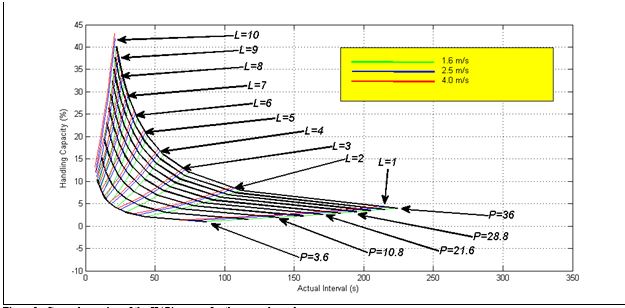
Figure 1: General overview of the HARint space for the example used.
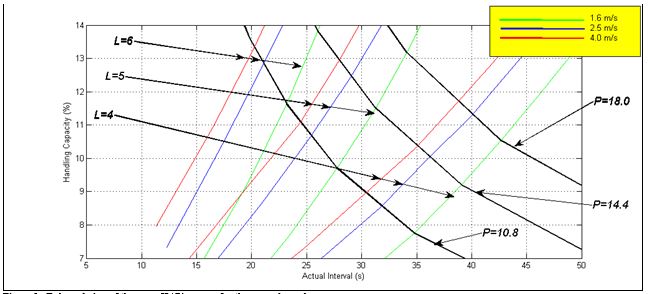
Figure 2: Enlarged view of the same HARint space for the example used.
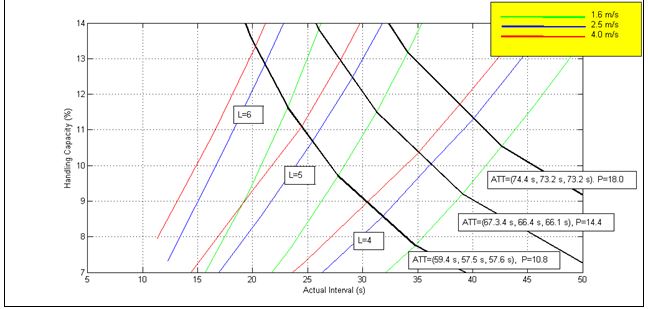
Figure 3: A view that shows that the constant P lines are also constant ATT lines.
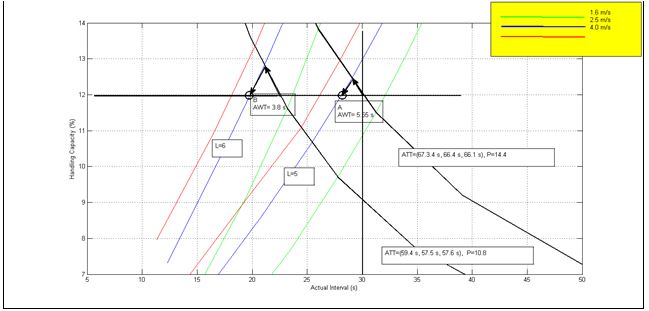
Figure 4: Two solutions A and B, one that meets the ATT requirement and one that does not.
Conclusions
The HARint space has been presented as a methodology that uses four user requirements in order to develop a compliant elevator traffic design. It relies on graphical methods to visualise the final solution.
The four user requirements are: the passenger arrival rate (AR%), the target interval (inttar), the target average travelling time (ATTtar) and the target average waiting time (AWTtar).
A comparison is shown below in table format between the HARint plane method and the HARint space method. The HARint space offers the advantage that it provides the optimum rated speed and meets all the four user requirements instead of just two requirements as is the case in the HARint plane.
| Category | The HARint Plane | The HARint Space |
| User requirements |
|
|
| Optimal outputs |
|
|
| Byproduct output |
|
|
| Triggers |
|
REFERENCES
- Lutfi Al-Sharif, Ahmad M. Abu Alqumsan, Osama F. Abdel Aal, “Automated optimal design methodology of elevator systems using rules and graphical methods (the HARint plane)”, Building Services Engineering Research & Technology, August 2013 vol. 34 no. 3, pp 275-293, doi: 10.1177/0143624412441615.
- CIBSE, “CIBSE Guide D: Transportation systems in buildings”, published by the Chartered Institute of Building Services Engineers, Fourth Edition, 2010.
- G. C. Barney, “Elevator Traffic Handbook: Theory and Practice”, Spon Press, London and New York, ISBN 0-415-27476-1, 2003.
- Richard Peters, “Lift traffic analysis: Formulae for the general case”, Building Services Engineering Research & Technology, 11(2), 1990, pp 65-67.
- Lutfi Al-Sharif, Ahmad M. Abu Alqumsan, Rasha Khaleel, “Derivation of a Universal Elevator Round Trip Time Formula under Incoming Traffic”, Building Services Engineering Research and Technology 0143624413481685, first published on-line June 13th, 2013 as doi:10.1177/0143624413481685.
- Lutfi Al-Sharif, Hussam Dahyat, Laith Al-Kurdi, “ The use of Monte Carlo Simulation in the calculation of the elevator round trip time under up-peak conditions”, Building Services Engineering Research and Technology, volume 33, issue 3 (2012) pp. 319–338, doi:10.1177/0143624411414837.
- Lutfi Al-Sharif, Ahmad Hammoudeh, “Evaluating the Elevator Round Trip Time for Multiple Entrances and Incoming Traffic Conditions using Markov Chain Monte Carlo”, International Journal of Industrial and Systems Engineering (IJISE), Inderscience Publishers, accepted for publication on 4th June 2013.
- http://www.inderscience.com/info/ingeneral/forthcoming.php?jcode=ijise
- So A.T.P. and Suen W.S.M., "New formula for estimating average travel time", Elevatori, Vol. 31, No. 4, 2002, pp. 66-70.
- Lutfi Al-Sharif, Osama F. Abdel Aal, Ahmad M. Abu Alqumsan, “The use of Monte Carlo simulation to evaluate the passenger average travelling time under up-peak traffic conditions”, Chartered Institute of Building Services Engineers, Symposium on Lift and Escalator Technologies, 29th September 2011, University of Northampton, United Kingdom (www.liftsymposium.org/index.php/previous-events).